Planning and management of droughts in the Segura river basin
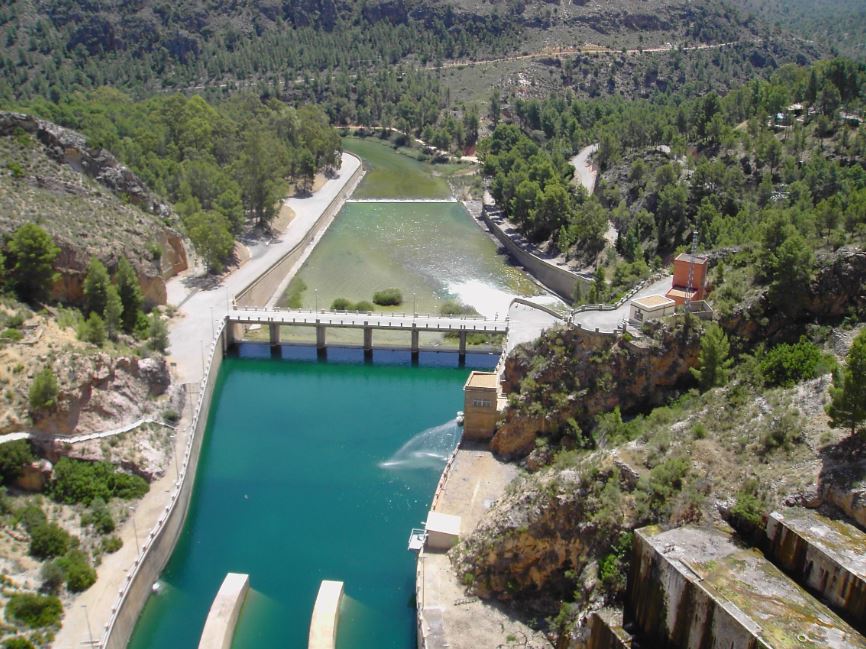
Cenajo reservoir downstream
ABSTRACT: The severe drought in period 1990-1995 triggered the inclusion of droughts on water resources planning.
The Segura River Basin Management Plan (2014) proposes environmental flow regimes calculated with a scientific basis which is under review and improvement in the coming years. The flow regimes do not reproduce the natural variability of historic flows. And this is a consequence of the altered regimen imposed due to the high regulation in the Segura River.
The Segura Drought Management Plan (2007) aims towards surface water supply re-strictions, but the Plan does not consider any indicator of the groundwater.
This paper proposes:
1) A methodology based on the analysis of droughts in Segura River in order to find new minimum flow regimes that will represent the natural variability of the river at a monthly scale, during periods of drought.
2) The consideration of an indicator to tackle groundwater abstraction during periods of drought.
1. INTRODUCTION
This paper describes a methodology based on the analysis of droughts in Segura River to find new minimum flow regimes that will represent the natural variability of the river at a monthly scale, during periods of drought. Besides, the contribution introduces an indicator to tackle groundwater abstraction during periods of drought.
At present there is an increasing social demand for respect and preserve the environment. This fact is conditioning water planning at European level, so that the rivers must drive, at least, environmental flows during droughts. Such reality appears strongly in regions where rivers are highly regulated. And this is the case of Segura River.
The implementation of environmental flow regimes in Segura River is a challenge for the coming years, because it is necessary to understand that some of the water of the river shouldn’t be available for consumption. So it is essential the participation of the stakeholders.
The performances in drought situations must respond to a planned management and not just emergency actions involving high costs for the society.
During periods of drought the supply of irrigation for a large part of Segura River Basin depend on groundwater. A significant proportion of wetlands and rivers are also dependent on groundwater.
Good status of groundwater is critical to achieving environmental and socio-economics objectives of the EU. On the other hand, over-abstraction leads to groundwater depletion, with consequences like deterioration of water quality (e.g. saline water intrusion), loss of habitats (e.g. wetlands) and modification of river/aquifer interactions.
Reduced groundwater levels can be a result of groundwater abstractions, reduced precipitation… So the groundwater level indicator has great relevance along drought periods.
2. DROUGHTS IN THE SEGURA RIVER BASIN
During the drought period 1990-1995, in the Segura River Basin, reductions of rainfall higher than 45% was happened, in the hydrological years 1993/94 and 1994/95, compared to the average of the period 1940/41 to 1994/95. These rainfall reductions triggered declines higher than 70% of the average annual inflow. The shortage in rainfall in the Segura River Basin led to greater shortages in rivers flows.
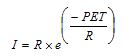
The rainfall-runoff relationship is not linear, and reductions of precipitation usually produce more pronounced reductions in runoff. And this physical phenomenon is considerate in the Equation (1).
 (1)
(1)
Where I = inflow; R = rainfall; and PET = potential evapotranspiration.
In the equation, all units are in millimeters (mm).
In the Figure 1 is represented Budyko law (Témez 2004). It can be checked the fit of the curve (PET 900 mm) with rainfall and inflows values from different periods of drought: 1941-1945, 1979-1983, 1990-1995 and 2004-2008. These values are shown in the Table 1.
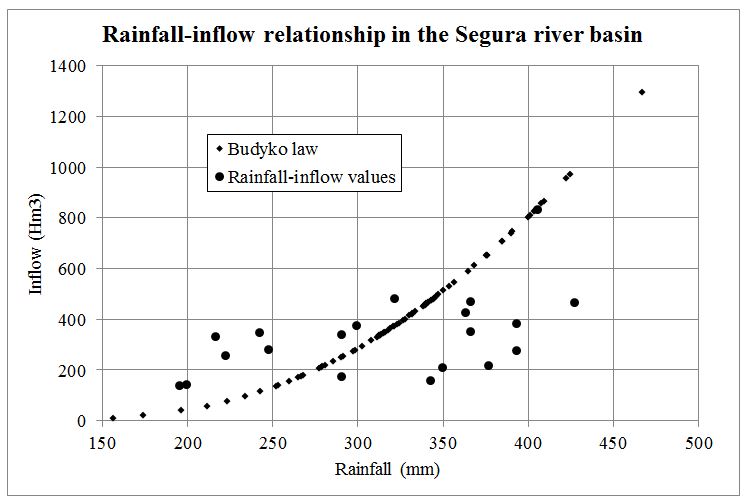
Figure 1. Rainfall-inflow relationship in the Segura River Basin with PET 900 mm. Values from periods of drought 1941-1945, 1979-1983, 1990-1995 and 2004-2008.
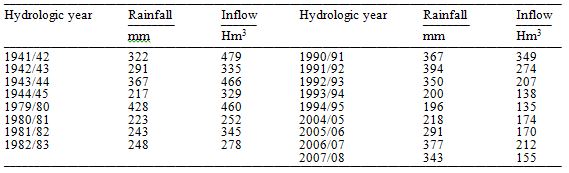 Table 1. Rainfall-inflow values during periods of drought.
3. MINIMUM FLOW REGIMES BETWEEN OJÓS DAM AND ARCHENA
In the last years, the methods for calculating the environmental flow regimes have undergone significant development, in order to achieve an objective environmental status for each river reach. This paper describes a methodology based on the analysis of droughts in Segura River to find new minimum flow regimes that will represent the natural variability of the river at a monthly scale, during periods of drought.
The methodology is applied on the reach of the river between Ojós and Archena, using preceding data at the entry into operation of major reservoirs in headwater basin.
3.1. Input data
It will be used the average daily flows that were recorded at station of Archena, in the period between 1920/21 and 1930/31. These data were obtained from the Gauging Yearbook of the Ministry of Agriculture, Food and Environment (MAGRAMA 2012).
With the average daily flows it was calculated average monthly flows for each year, as shown in the Table 2:
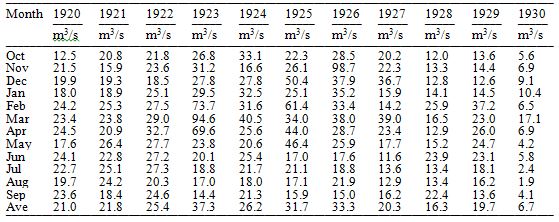
Table 2. Average monthly flows at station of Archena in the period between 1920/21 and 1930/31.
3.2. Classification of hydrological years
With the results of annual circulating volume (Tab. 3) it is proposed to classify the hydrological years in normal, wet or dry, with the following criteria:
– If volume is fewer than 300 Hm3 then it considers dry year.
– If volume is greater than 300 Hm3 and fewer than 700 Hm3 then it considers normal year.
– If volume is greater than 700 Hm3 then it considers wet year.
According to this classification, in the period under review, there’s one dry year (1930/31), five normal years and five wet years.
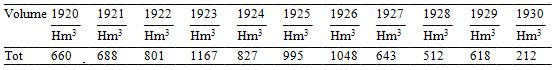
Table 3. Annual volume at station of Archena in the period between 1920/21 and 1930/31.
3.3. Flow distribution depending on the type of year
It is proposed the following average monthly flow distributions: for dry years the distribution of the year 1930/31. For normal and wet years the distribution corresponding to average values. The results obtained are shown in the Table 4.

Table 4. Average monthly flow distributions depending on the type of year.
The average monthly flows in natural regimen show variability along the hydrological year. The regimen of the river at that time was linked to meteorological variability of the basin. The low rainfall in summer originated severe droughts.
Therefore, accused droughts are observed in dry years. On July 8 th 1931 a daily average flow of 0.32 m3/s was recorded in station of Archena.
3.4. New monthly minimum flow regimes
The Segura River Basin Management Plan (2014) establishes the environmental flow regimen, during droughts, which can be seen in the Table 5:
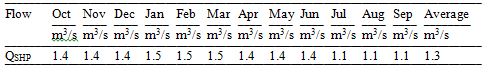
Table 5. Environmental flow regimen in the Segura River between Ojós and Archena, during droughts.
But this flow regimen does not reproduce the natural variability of historic flows along hydrological year. These flows respond to the altered flow regimen that imposes the high regulation existing in the Segura River Basin.
Then the new monthly flow regimen in situations of drought is calculated as follows:
Between October and March the regimen would be 15% of average monthly flows for the normal year.
From April to September the regimen would be 50% of the monthly flows for the dry year.
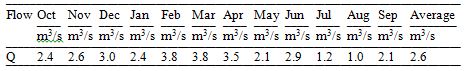
Table 6. Monthly flow regimen in situations of drought.
Montana method recommended flow rates calculated as a percentage of average annual flow restored to natural regimen in the wet season and dry season (Tennant 1976). According this methodology, if more than 90% of the average annual flow is abstracted, it could trigger the beginning of the damage in the river and its biodiversity. Therefore, 10% of the average annual flow should be a reference threshold.
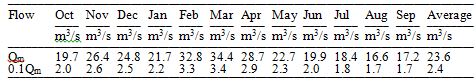
Table 7. Average flow distribution in the period between 1920/21 and 1930/31.
The Figure 2 shows that the proposed flow regimen is close to the 10% of the average monthly flow in the period 1920/21 to 1930/31.
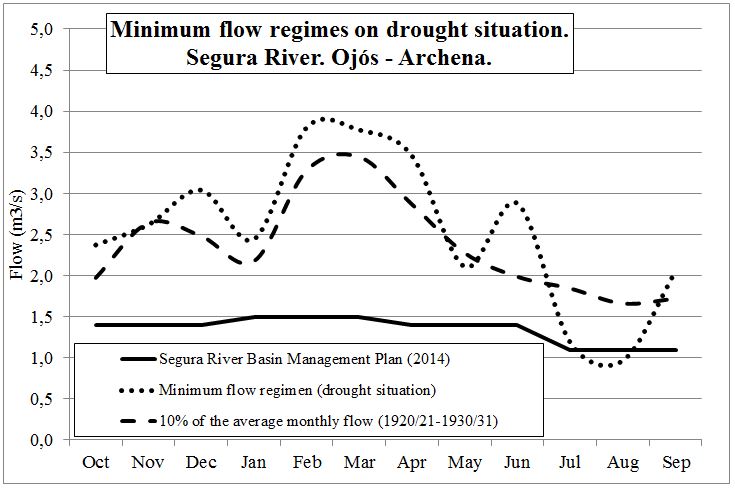
Figure 2. Minimum flow regimes on drought situation. Segura River. Ojós-Archena.
4. THE GROUNDWATER INDICATOR
Low groundwater levels may be caused by periods of low rainfall during the period of recharge (generally in autumn and winter), but the effects can be prolonged or made worse by abstraction at critical periods.
In the Segura River Basin during droughts, groundwater is placed under even greater pressure due to different users (agriculture, industry…) pump out too much water.
As the different water bodies (rivers, lakes, aquifers, wetlands) are hydraulically connected, groundwater level reduction will result in reduction of water resources, imbalance in the hydrologic water cycle and can lead to serious water stress and scarcity conditions.
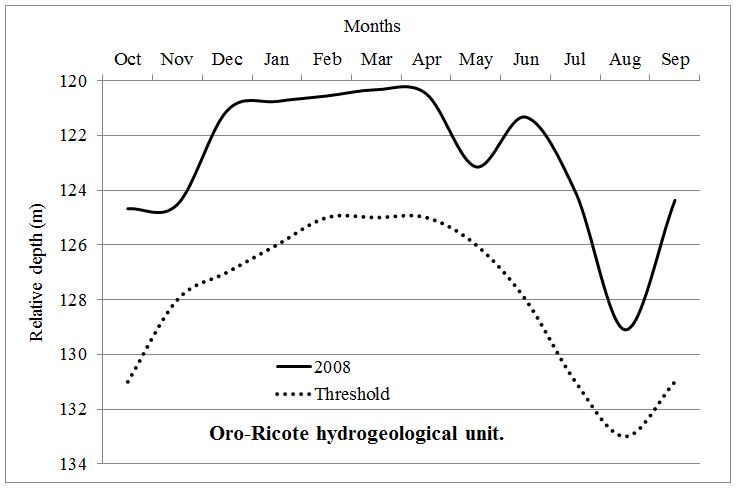
Figure 3. Evolution of the relative depth in the year 2008/09. Piezometer “Pozos de Torres”.
Figure 3 shows the evolution of the relative depth in Oro-Ricote hydrogeological unit during the year 2008/09 with an example of lower threshold.
For each piezometer, thresholds would be established in order to know the state of the aquifer in the influence area.
The groundwater level indicator can be presented on a map of the Segura River Basin. The map would show the situation of groundwater level every month, for each aquifer.
5. CONCLUSIONS
In the Segura River Basin the reduction of rainfall leads to more pronounced reductions in rivers flows. Besides, the Segura River is strongly regulated. Therefore, it’s not easy reproducing the natural variability of historic flows and it’s difficult respecting the environmental conditions in the river, especially during droughts.
This paper describes a methodology based on the analysis of low flows in a reach of the Segura River, which uses historical data of natural flows. It has been proposed a new minimum flow regimen between Ojós and Archena. The new regimen obtained is representative of the natural variability of the river during droughts.
The implementation and monitoring of the minimum flows in the Automatic Hydrological Information Systems at Water Authorities would be a useful control tool.
The consideration of a groundwater level indicator has great relevance during periods of drought.
The groundwater indicator can be used to assess hydrological drought and if it is combined with other indicators, it can be used for water policy (restriction of water use, management at local level, awareness raising purposes…)
Finally, this little paper aims the thinking on the need for European Drought Directive that homogenizes criteria about environmental flows and groundwater abstraction.
6. REFERENCES
Comité de Expertos en Sequía. 2007. La sequía en España. Directrices para minimizar su impacto. Ministerio de Medio Ambiente.
European Environment Agency, 2012. Towards efficient use of water resources in Europe. EEA Report No 1/2012.
Ferreras, C. 2004. Inundaciones y sequías en la cuenca del Río Segura. Comunidad Autónoma de la Región de Murcia. Consejería de Agricultura, Agua y Medio Ambiente.
Herrero, R. 2014. The last water resources planning and the environmental flows regimens in rivers. Tecnoaqua. Volume 5. 94-100.
Schmidt, G. et al. 2012. Environmental flows in the EU. Discussion paper. Draft 1.0, for discussion at the EG WS&D.
Tallaksen L. et al. 2004. Hydrological Drought. Processes and estimation methods for streamflow and groundwater. Elsevier.
Témez, J. R. 2004. El periodo seco 1980-95. Su rareza y efectos en el sureste español. Revista de Obras Públicas nº 3448. 33-39.
Tennant, D. L. 1976. Instream Flow Regimens for Fish, Wildlife, Recreation and Related Environmental Resources. Procs. on Instream flow needs Symp. 326-327.
2 Comments
Guido Schmidt says: 2015/01/09 at 15:36 //
Hola Raúl:
muy interesante trabajo.
en cuanto al Plan de Sequía, me surge inmediatamente la duda si su revisión se ha abordado en el nuevo borrador del Plan de Cuenca para el segundo ciclo 2015-2021 – es uno de los temas pendientes del primer ciclo para todas las cuencas intercomunitarias, ya que los primeros Planes de Sequía no decían prácticamente nada sobre aspectos ambientales.
En cuanto a los acuíferos, sugeriría utilizar mejor un análisis multianual incluyendo una sequía, creo que se puede expresar mucho mejor que en un gráfico solo referido a un año con la habitual época estival.
Un saludo, Guido
rauhermi says: 2015/01/10 at 10:38 //
Estimado Guido, muchas gracias por tu interés.
En la Demarcación del Segura, como tú bien apuntas, está pendiente revisar y también aplicar el Plan Especial frente a la Sequía (PES), para lo cual es necesario disponer de recursos presupuestarios.
En materia de sequías, es posible trabajar para acoplar el Plan de la Demarcación con el PES. De esta manera, si se incorporan las restricciones al suministro que contempla el PES la cuantificación del déficit medio interanual se reduciría significativamente en periodos de sequía.
La planificación debe ser flexible y debe adaptarse a la realidad del año hidrológico. De esta manera las demandas ya no se consideran fijas, sino que existe un margen de maniobra. En años secos tiene que aplicarse el PES, lo que supone una reducción de las demandas.
Este es un tema que debería dejar muy claro la “futura” Directiva Europea sobre Sequías.
Ante situaciones de emergencia por sequía, el PES de la Cuenca del Segura establece como acuíferos prioritarios para la apertura y entrada en funcionamiento de los “pozos de sequía” a los acuíferos que están en equilibrio y que todavía mantienen manantiales y ecosistemas asociados en buen estado. Pero ¿por qué las extracciones de agua subterránea necesarias en situación de emergencia no se realizan sobre alguno de los acuíferos ya sobreexplotados, en los que la funcionalidad ambiental de sus reservas es menor?
En cuanto a los acuíferos, tomo nota de tu aportación, porque me parece muy interesante y enriquece el análisis.
En la Demarcación del Segura existe una carencia de datos importante sobre aguas subterráneas. Es necesario mejorar los datos de calidad y niveles piezométricos con el objetivo de conocer más sobre el comportamiento de los acuíferos, tanto a nivel espacial como a nivel temporal.
Una vez que se disponga de esos datos, será el momento de plantearse la modelación de los acuíferos mediante modelos 3D.
En el Plan Hidrológico se ha realizado el inventario de presiones para las masas de agua superficiales, pero no para las aguas de transición y aguas costeras ni tampoco para las masas de agua subterráneas. Este tema hay que abordarlo para no incumplir la Directiva Marco del Agua, y para no invalidar las previsiones del Programa de Medidas.
Por lo tanto queda mucho por hacer en materia de diagnóstico sobre los recursos subterráneos disponibles, tanto en cantidad como en calidad, en esta Demarcación Hidrográfica. Por ejemplo, se necesita realizar un diagnóstico sobre los caudales de los acuíferos a través de manantiales, presiones a que están sometidos y medidas para su protección y recuperación. Hay que tener en cuenta que una parte importante de los manantiales y humedales asociados a las aguas subterráneas de la cuenca del Segura han sufrido procesos de desecación, reducción de caudales y degradación general de sus condiciones ambientales. En definitiva, es necesario potenciar el mantenimiento de fuentes y manantiales ya que tienen una importante función ambiental y social.
Un cordial saludo desde Murcia. Raúl.